PToolsRTE 0.55 and later include a tool that can help identify the nature and location of runtime errors in a multi-language program at the point of failure. This tool is integrated in the TAU Performance System, a portable profiling and tracing toolkit for performance analysis of parallel programs written in Fortran, C, C++, Java, or Python. The tool:
- Isolates the fault by capturing the signal associated with it,
- Reports the program callstack and performance data at the point of failure and stores detailed information for each frame in the callstack,
- Generates a file that may be shipped back to the developers for further analysis,
- Works on parallel programs,
- Provides feedback about every process regardless of whether it experienced the fault,
- Is useful to both software developers and users experiencing runtime software issues such as a segmentation violation or a floating point exception,
- Addresses security concerns by avoiding the need for the user to provide the problem geometry and inputs to the development team diagnosing problems.
TAU is the preferred tool for debugging complex multi-language programs that use PToolsRTE since traditional debugging tools do not fully support state inspection while examining failures in multi-language applications written in a combination of Python, C++, C, and Fortran. Without TAU, it is difficult to relate the location of the runtime fault to the original source code and examine the performance of the application.
TAU enables users and developers to answer questions such as:
- What was the routine name, source file name, line number and module name at the fault location?
- What was the nature of the fault?
- What was the heap memory utilization in the application at the time of failure?
- Were there any memory leaks in the application?
- What was the level of nesting in the callstack?
- What were the performance characteristics of the application at that time?
- How much time did the application spend in I/O, computation, and communication operations before the time of fault?
The tool achieves this without re-compiling or re-linking the application and supports evaluation of the fault diagnostics and performance of codes that use multiple languages such as Python, Fortran, C, and C++.
Tutorial
This tutorial will show you how to apply TAU’s performance analysis and debugging features to a multi-language code, such as Helios or Kestrel. This attached example code is from Helios 2.0 and will be used throughout the tutorial. Copy the example to your $WORKDIR on any DSRC systems and extract the tarball to create the py-c++-f90-create folder. I will be using the Diamond, the SGI Altix ICE system at ERDC, but you should be able to complete the tutorial on any DSRC system. If you are not using Diamond, please be sure that the correct compiler and MPI modules are loaded before continuing.
Load PToolsRTE and TAU into your environment
Before you can use PToolsRTE and the performance analysis and debugging features of TAU, you must add the PToolsRTE installation to your shell environment. PToolsRTE 0.55 is installed on all DSRCs at $PET_HOME/pkgs/ptoolsrte-0.55; the latest version of PToolsRTE is always symlinked to $PET_HOME/pkgs/ptoolsrte. The preferred way to load PToolsRTE and TAU is via environment modules:
module use $PET_HOME/pkgs/ptoolsrte/etc
module load ptoolsrte
If you do not wish to use the PToolsRTE module, you may source the appropriate shell script. For Bash, it is:
source $PET_HOME/pkgs/ptoolsrte/etc/ptoolsrte.bashrc
for C-Shell, it is:
source $PET_HOME/pkgs/ptoolsrte/etc/ptoolsrte.cshrc
Once you have PToolsRTE in your environment, the default TAU, Python, NumPy, SWIG, and CMake executables will be supplied by PToolsRTE. Additional features such as IPython are also available. Please visit the [[PToolsRTE|PToolsRTE website]] for more information.
Compile the application code with debugging symbols
TAU uses debugging symbols in program executables and dynamic shared object (DSO) libraries to translate the memory addresses of functions and variables to filenames and line numbers. To add debugging symbols, pass the “-g” flag to your compiler. The example makefile has already been modified to include the “-g” flag. Adding “-g” does not preclude optimization: it is perfectly legal mix “-g” with optimization flags such as “-O3”. Most compilers will optimize just as effectively with debugging symbols enabled, but note that IBM XL compilers will disable function inlining when “-g” is used. It’s OK to skip this step if you are unable to rebuild the code. TAU will still produce profile information, but the profiles generated may be less informative since some addresses will not be resolved to filenames.
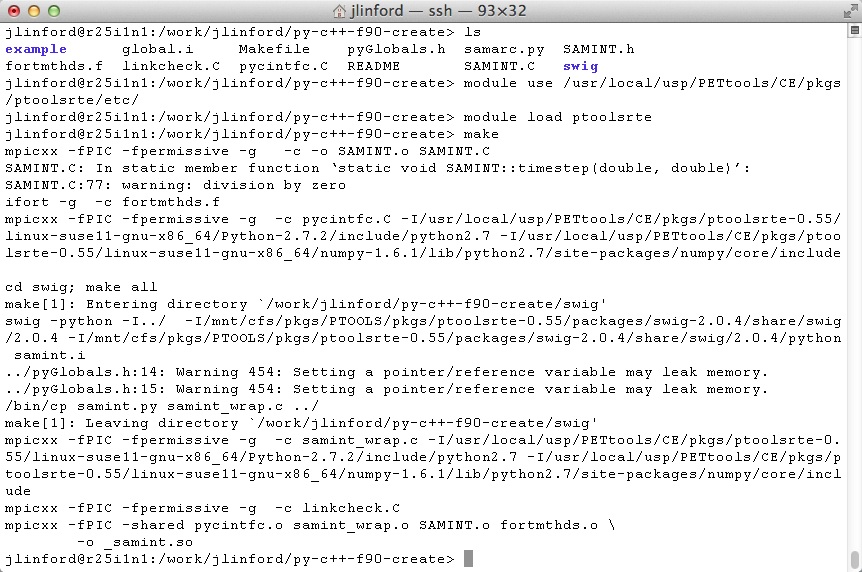
The py-c++-f90-create example code uses the Intel Fortran compiler by default. Here is the output from compiling the example on Diamond:
Create a Python wrapper to profile Python events
You can call TAU’s Python interface from a wrapper file to automatically instrument Python functions and track interesting Python events that happen behind the scenes in your application. The simplest wrapper is just a few lines long and is already included for you in the py-c++-f90-create/example folder:
#!/bin/env python
import tau

def OurMain():
     try:
         # Change this line to launch your Python application
         import samarcrun
     except SystemExit:
          # Intercept the exit call to prevent Python
          # from killing TAU
          print 'SystemExit intercepted by wrapper'

tau.run('OurMain()')
Launching TAU from within python allows you to use TAU in your unit tests or other situations it is useful to automatically gather performance data.
Use tau_exec to execute the application
With debugging symbols added to your binaries and a wrapper file for Python, the only remaining step is to launch your application with tau_exec. You can do this from a PBS batch script or an interactive session.
There are two steps to launching your application with TAU. First, you must specify the TAU features you wish to use by setting the appropriate environment variables. In our case, we want to use TAU’s signal tracking features to intercept a floating point exception that occurs in the example. We also want to view the program callstack to a depth of 100 calls. To achieve this, we set the following environment variables:
export TAU_TRACK_SIGNALS=1
export TAU_CALLPATH_DEPTH=100
Secondly, launch your application by passing wrapper.py to tau_exec along with the “-T python” parameter. For example, if your typical launch command is
mpirun -n 4 pyMPI ./samarcrun.py
import samarcrun from wrapper.py (as we have done above) and launch with:
mpirun -n 4 tau_exec -T python pyMPI ./wrapper.py
Or, if your launch command looks like
mpirun -n 128 ./helios.py
replace “import samarcrun” with “import helios” in wrapper.py and launch with:
mpirun -n 128 tau_exec -T python ./wrapper.py
Here is the output from running the example with TAU on Diamond:
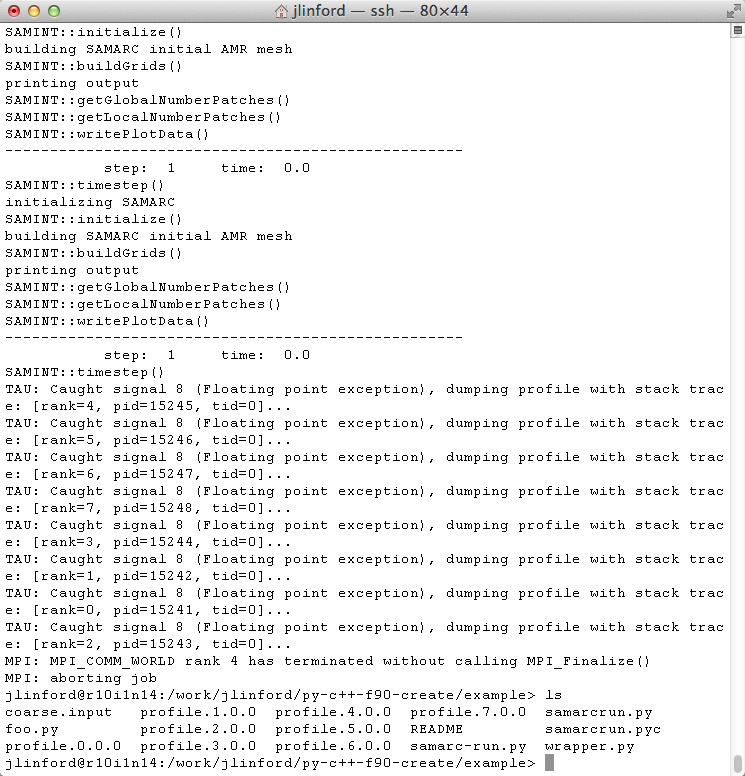
Notice that TAU has intercepted the SIGFPE and generated profile data for each MPI process. We can now analyze this profile data to discover the cause of the error and view the application’s performance characteristics up to the point of failure.
Use ParaProf to analyze the profile data
TAU includes the ParaProf graphical profile browser. ParaProf is a graphical application and you can run it remotely with X11 forwarding, but you will get better performance if you run it on a local workstation. (Note that you will also get good performance from a VNC session on a DSRC utility server if you prefer not to transfer the files off the DSRC.) The easiest way to do that is visit the TAU download page and install TAU locally. Once you have a local installation of TAU, execute the following commands on the remote system to collect the profile data into a single compressed, portable file:
paraprof --pack py-c++-f90-create.ppk
This will generate a ppk file containing all the data from the profile.* files that TAU generated. The argument to the “–pack” flag is the name of the ppk file you wish to create. You can use any descriptive name here. Once you’ve created the ppk file, use SSH to download this file:
scp diamond03.erdc.hpc.mil:/work/jlinford/py-c++-f90-create/example/py-c++-f90-create.ppk .
My py-cxx-f90-create.ppk file is attached in case you want to compare your results to mine. On Windows and Mac OS you can simply double-click the profile file to start ParaProf. Otherwise, start it from the command line with
paraprof py-c++-f90-create.ppk
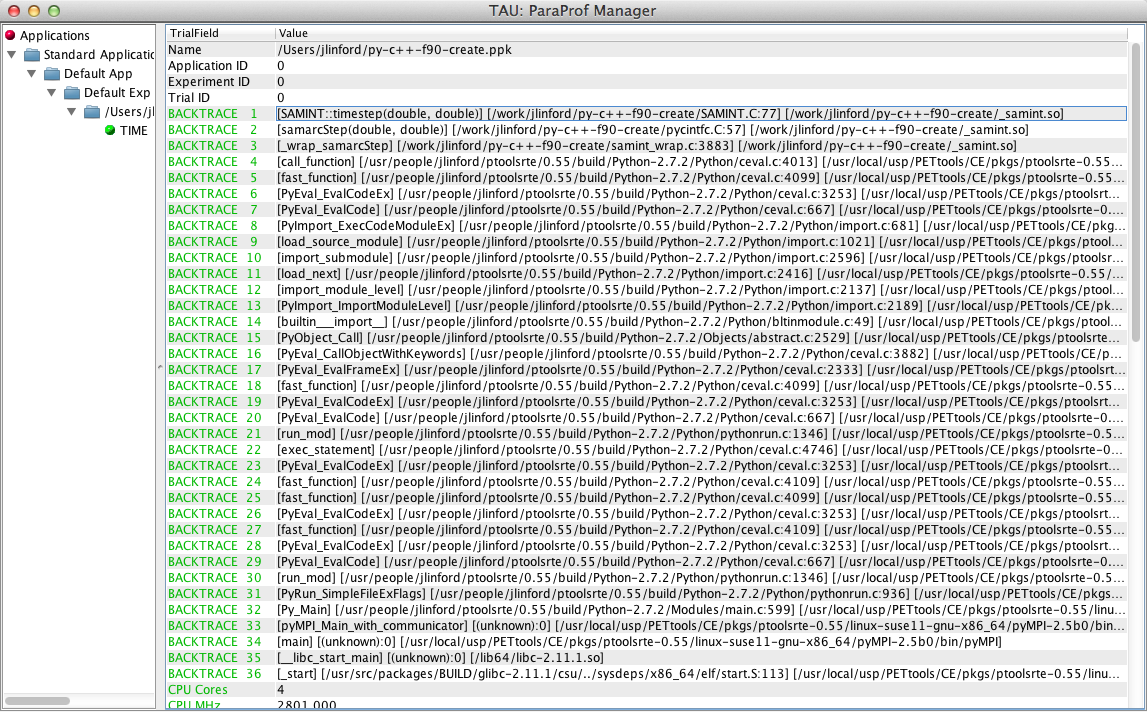
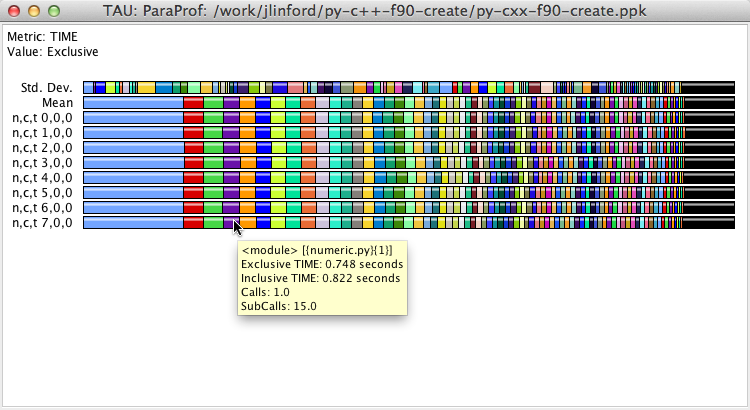
ParaProf will open two windows: the ParaProf Manager and a stacked bar chart showing exclusive time in various regions of the application code.
Where and when did the program experience the runtime fault?
The first question you want answered when your program crashes is “what line of code caused this behavior?” To find out, go to the ParaProf Manager window and find the backtrace entries on the right-hand side. Each backtrace entry is a three-tuple comprised of the routine name, the source file defining the routine, and the name of the executable or DSO containing the compiled routine. The first backtrace entry matches the top of the program stack at the point when the application failed. This shows us that the py-c++-f90-create application failed in the SAMINT::timestep(double, double) routine, which is defined at line 77 of SAMINT.C.
The backtrace entries shown in the Manager window have been merged from all threads. If a backtrace entry is shown in red then the callpath diverged on one or more threads at that point. For example, Thread 0 may have called foo(), but Thread 1 called bar(). If all threads followed the same callpath then the backtrace entry is shown in green. You can right-click on the name of a thread in the stacked bar chart window to view each thread’s callpath.
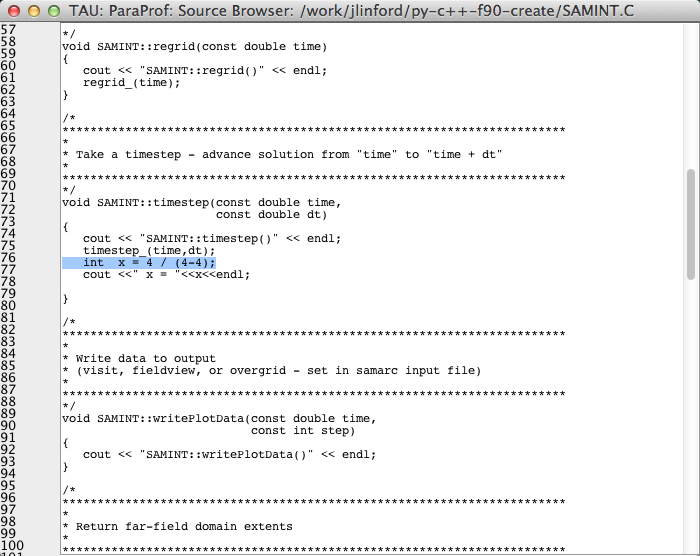
You can view this source line in context by right-clicking on the backtrace entry and selecting Show Source Code. The ppk file does not contain any source code, so if you are viewing this file locally you will be prompted for the location of the py-c++-f90-create source. In that case, download and unpack the example on your local machine and then follow the prompts in ParaProf to add the newly-created local copy of the source to ParaProf’s search path. Once ParaProf is able to locate the program source code, the errant line will be highlighted in the source code browser:
What was the nature of the fault?
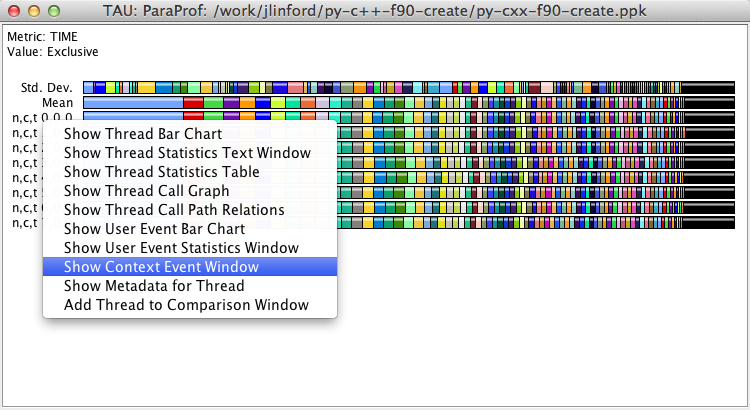
Use the ParaProf Context Event Window to explore the kind(s) of errors that occurred during the application run. To open the Context Event Window, right-click on the name of the thread you wish to examine in the exclusive time bar chart:
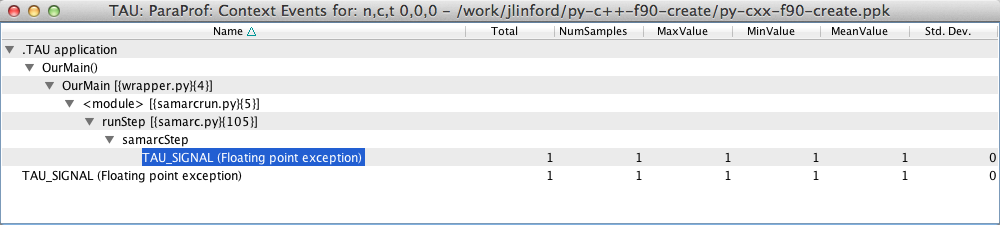
The Context Event Window displays both the type and location of the runtime exception:
What was the heap memory utilization in the application at the time of failure?
You can track memory usage in an application by passing the “-memory” flag to tau_exec. You do not need to recompile your code. To see heap memory utilization in the example, just re-execute it with the “-memory” flag:
mpirun -n 4 tau_exec -T python -memory pyMPI ./wrapper.py
TAU will again generate profile files. Use ParaProf to pack the files:
paraprof --pack py-cxx-f90-create_memory.ppk
My py-cxx-f90-create_memory.ppkk file is attached if you want to check your results.
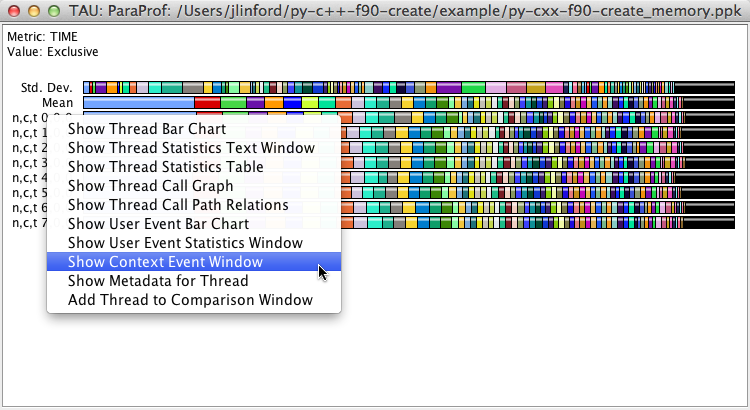
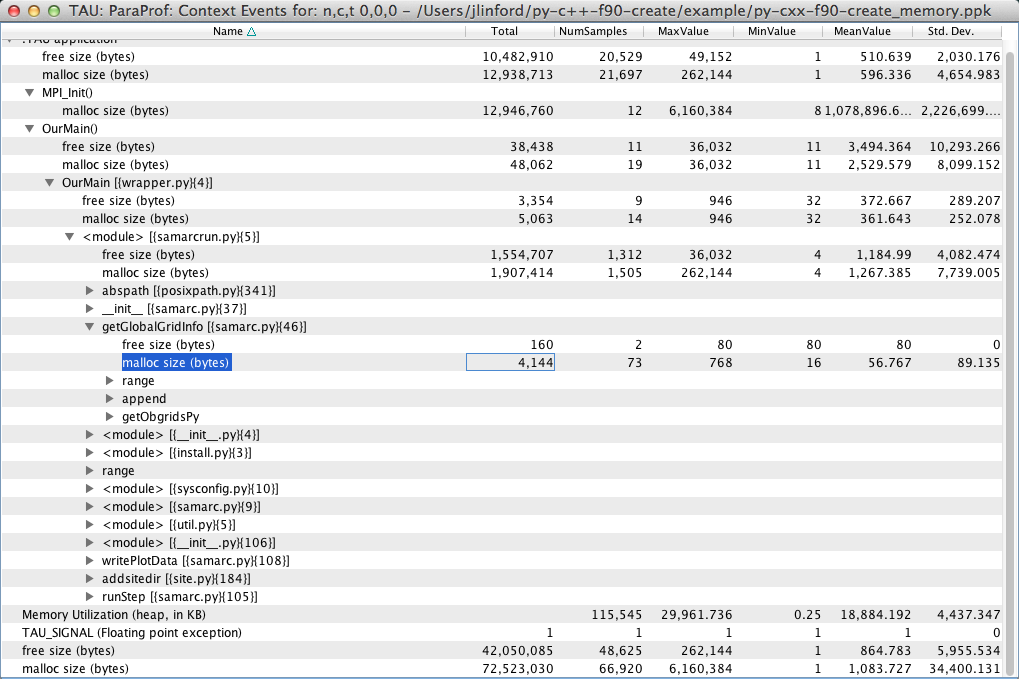
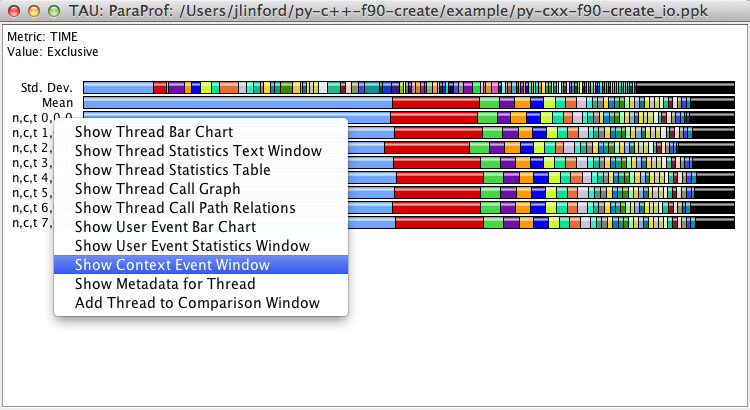
As before, open this new ppk file in ParaProf, right-click on the name of a thread you wish to examine, and select “Show Context Event Window”:
The context event window now shows information from malloc and free along with the aggregate heap memory utilization. Here we see that Thread 0 in our example used a maximum of 29,961.736 KB of heap memory. If you view the context event windows of the other threads, you will see that they have different memory usage characteristics.
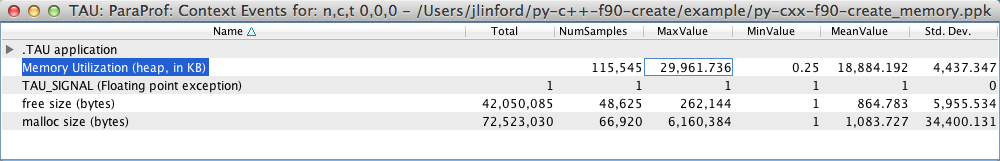
Expanding the .TAU application node in the Context Event window will show you the amounts of memory that were allocated and freed in each part of the program. Here we see that getGlobalGridInfo allocated a total of 4,144 bytes of heap memory in 73 malloc() calls. The largest allocation in getGlobalGridInfo() was 768 bytes, and the smallest was only 16 bytes. Note that, as expected, the mean multiplied by the number of samples is very close to the total.
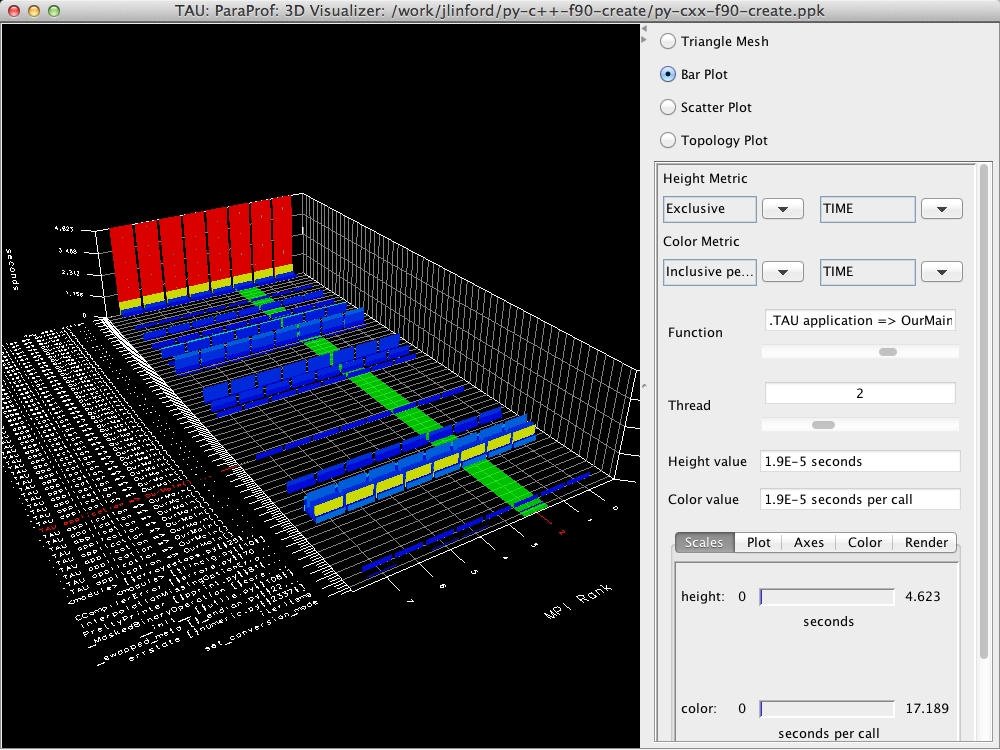
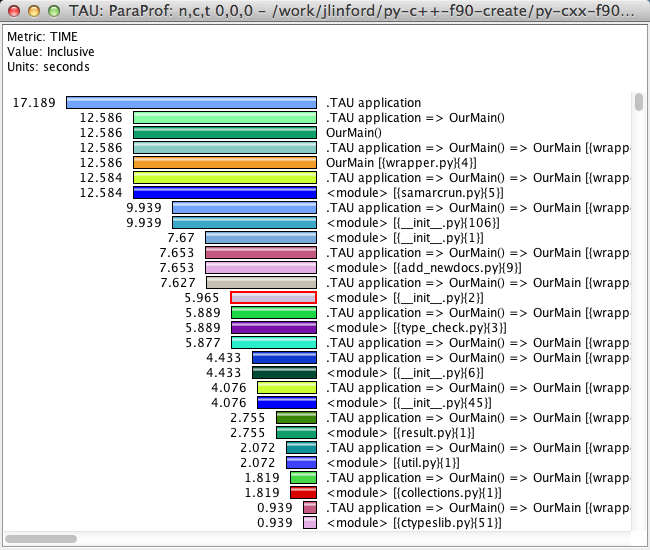
What were the performance characteristics of the application at that time?
TAU profiles include a large amount of performance data. Metrics such as inclusive and exclusive time, number of calls, time per call, IO bytes, and MPI message size can be viewed in 2D barcharts or interactive 3D visualizations. This information is available for all Python, C, C++, and Fortran routines when the TAU compilers are used.
What were the file IO characteristics of the application before the fault?
TAU will track IO operations if you pass the “-io” flag to tau_exec. Just like heap memory usage tracking, you do not need to recompile your code to get this information. Simply pass the “-io” flag to tau_exec when launching your application:
mpirun -n 4 tau_exec -T python -io pyMPI ./wrapper.py
TAU will again generate profile files. Use ParaProf to pack the files:
paraprof --pack py-cxx-f90-create_io.ppk
My py-cxx-f90-create_io.ppk file is attached if you want to check your results.
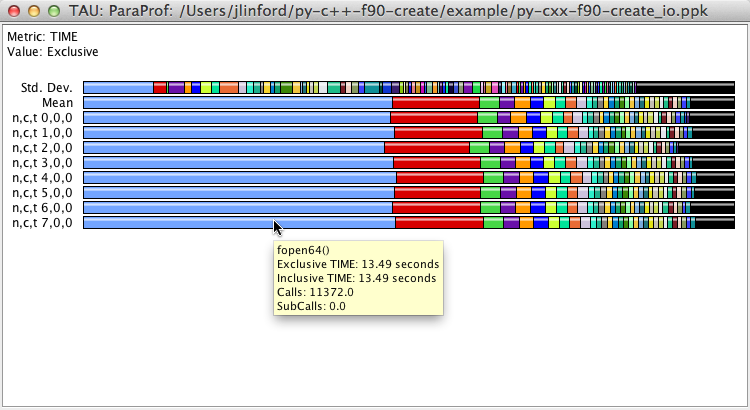
As before, open this new ppk file in ParaProf. Notice that the bar chart looks significantly different from before because time spent in fopen64() has been added to the chart. Notice also that the time spent in file IO varies slightly from thread to thread. Hovering your cursor over the fopen64() entry will show the time that thread spent in fopen64() and the number of times it was called.
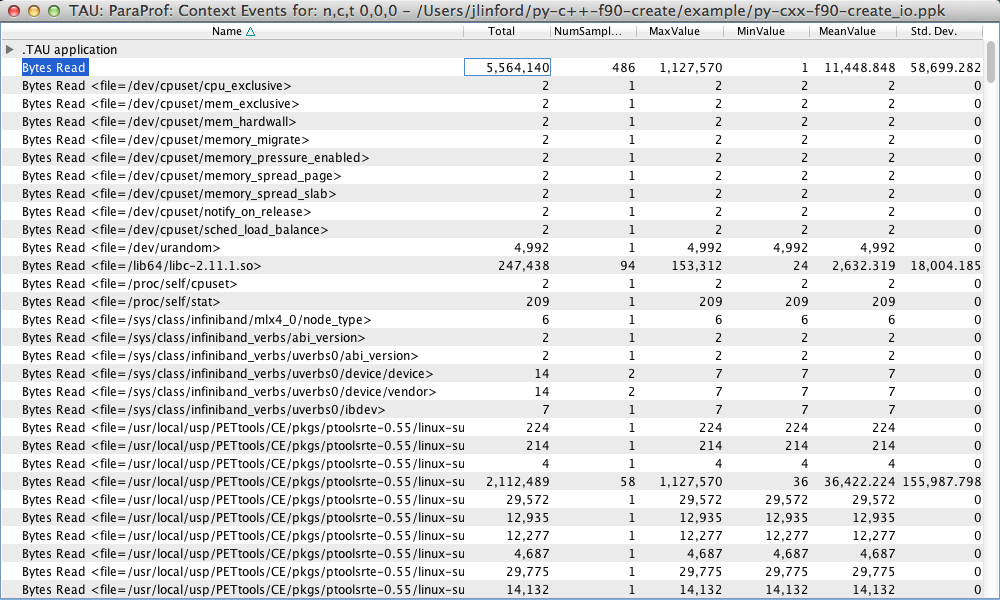
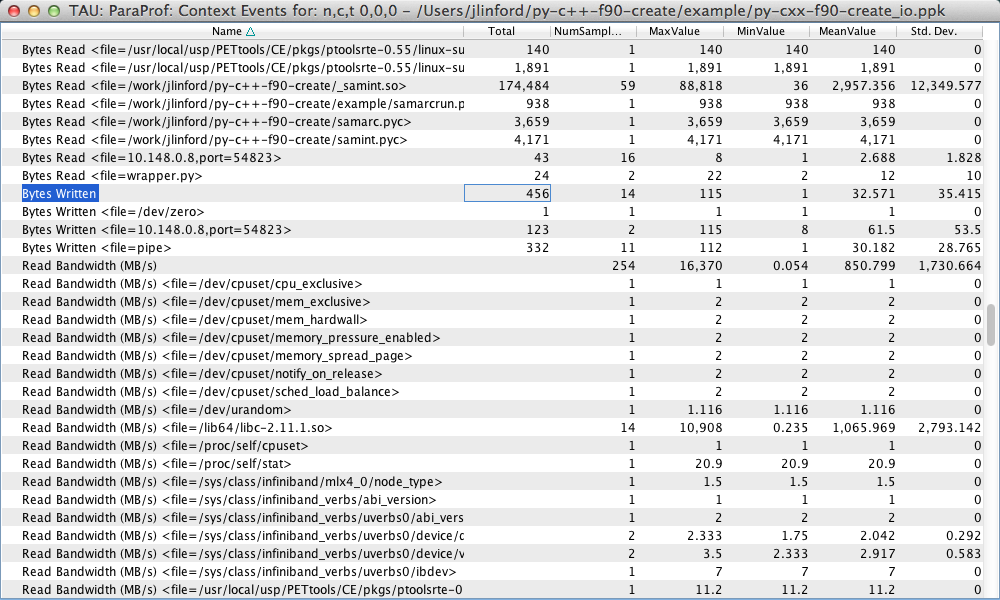
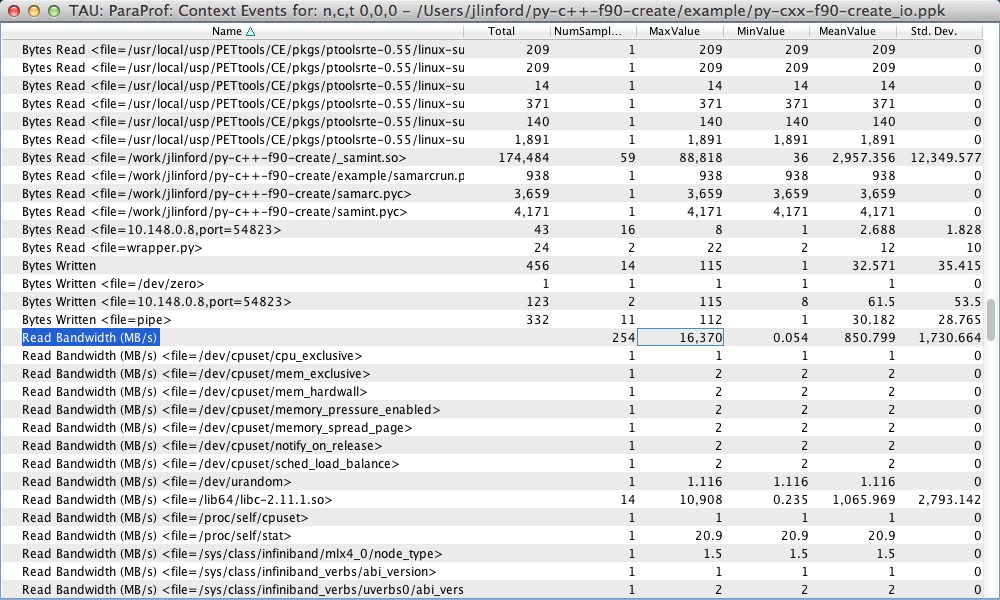
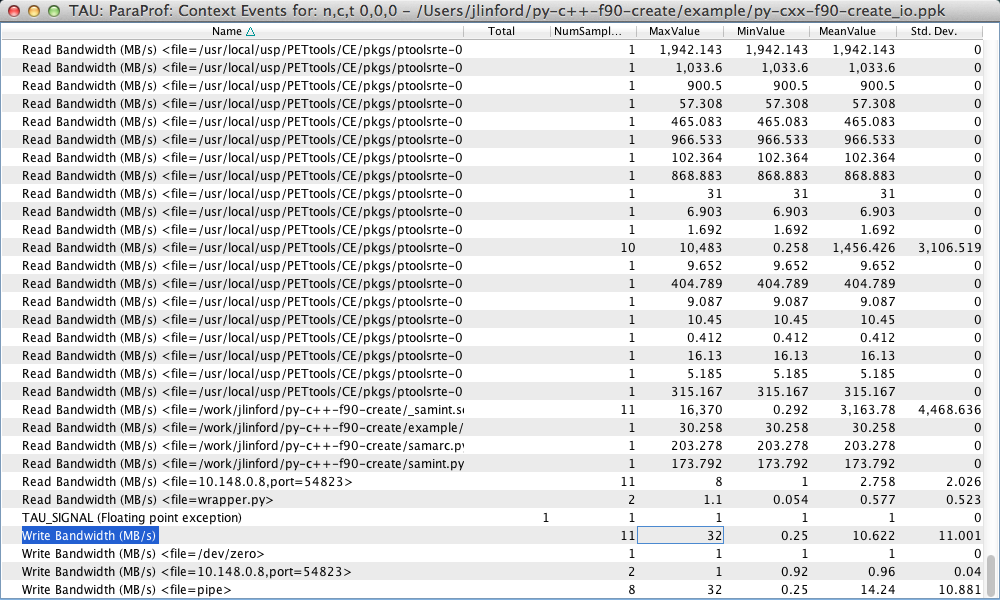
As before, more detailed information is available in the Context Event window:
Here we see information about the number of bytes read and written and the read/write bandwidth for each individual file and in total. We see that our example code read a total of 5433.73 KB and wrote a total of 456 bytes.