Example: MPI only
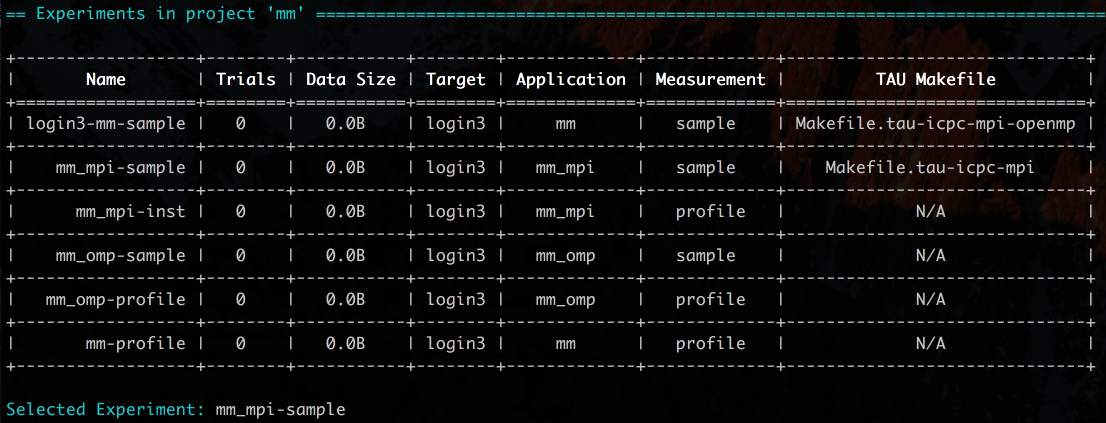
We first select the experiment for profiling a MPI-only version mm via sampling.
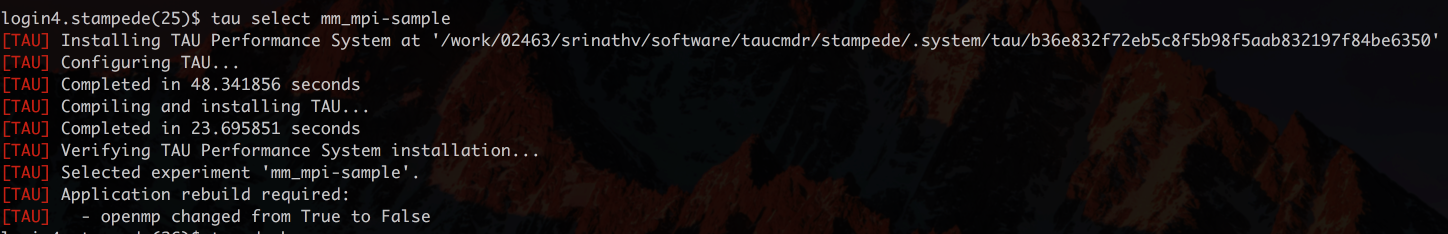
At this point, Tau Commander will begin to create the corresponding TAU and any other dependent libraries to accomplish this experiment. Below is the “tau dash
after we have selected “mm_mpi-sample”.
We now build the mm_mpi application with no need for instrumentation because we are relying on sampling to make our mpi and execution measurements. The included Makefile.intel shows that the compiler invocation “mpicc” is now replaced with “tau mpicc”. 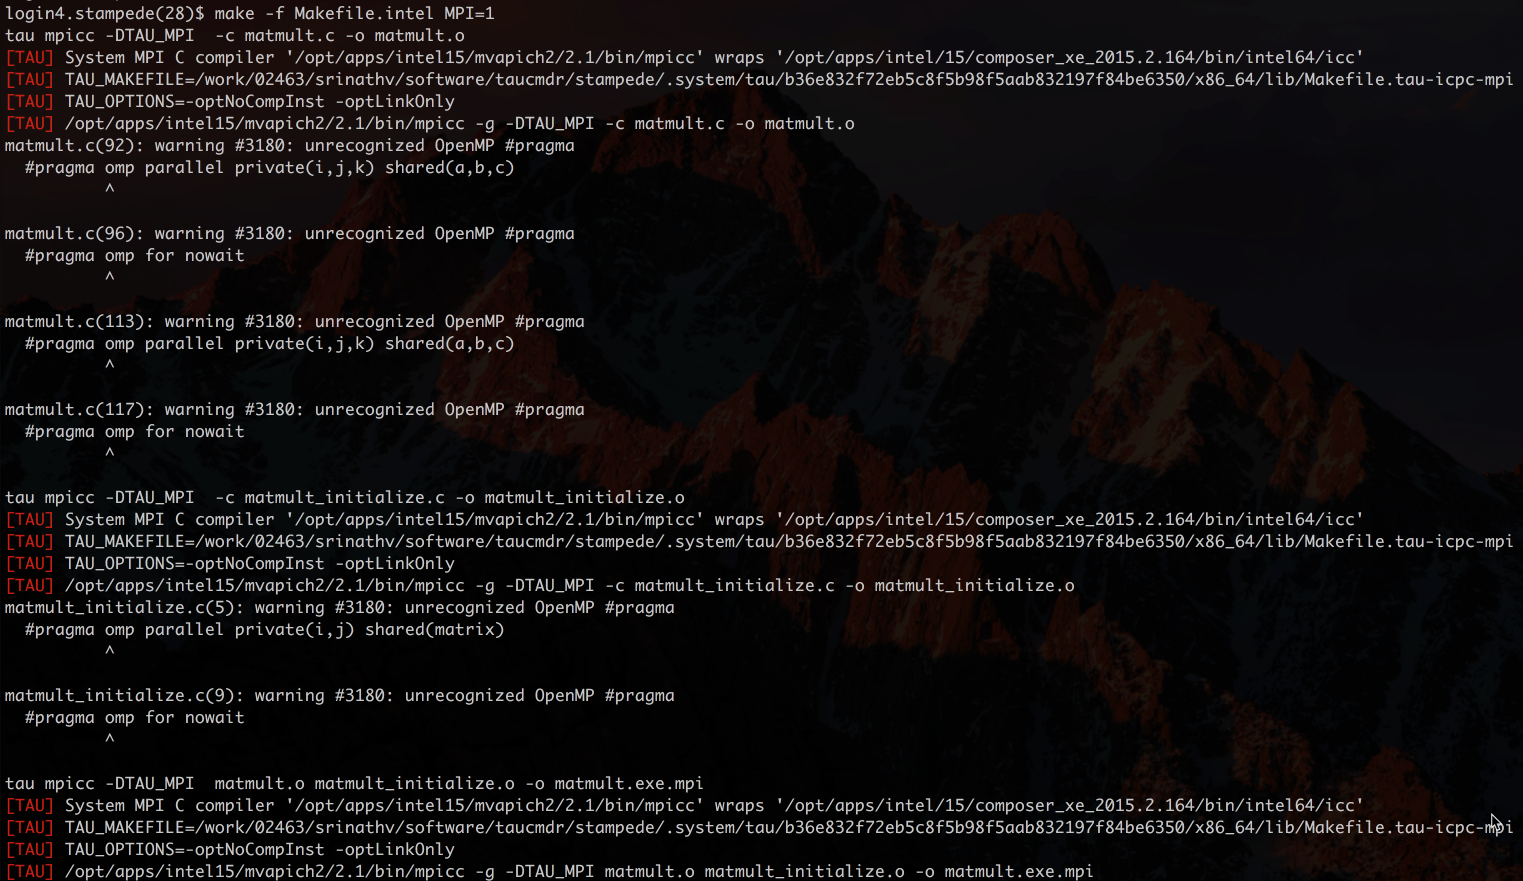
We run the example inside an interactive que idev. At this point we have only created experiments but not trials which constitute running the application and collecting results.
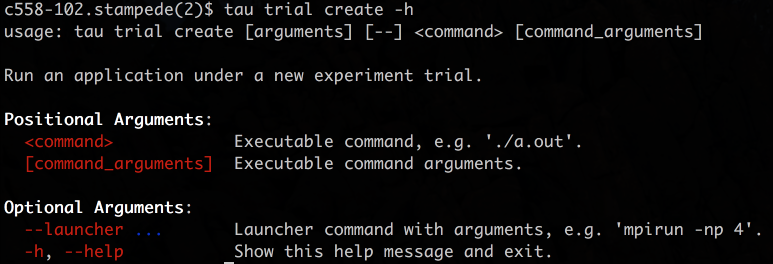
We see how to create a trial (ie. run the experiment) by using the help command.
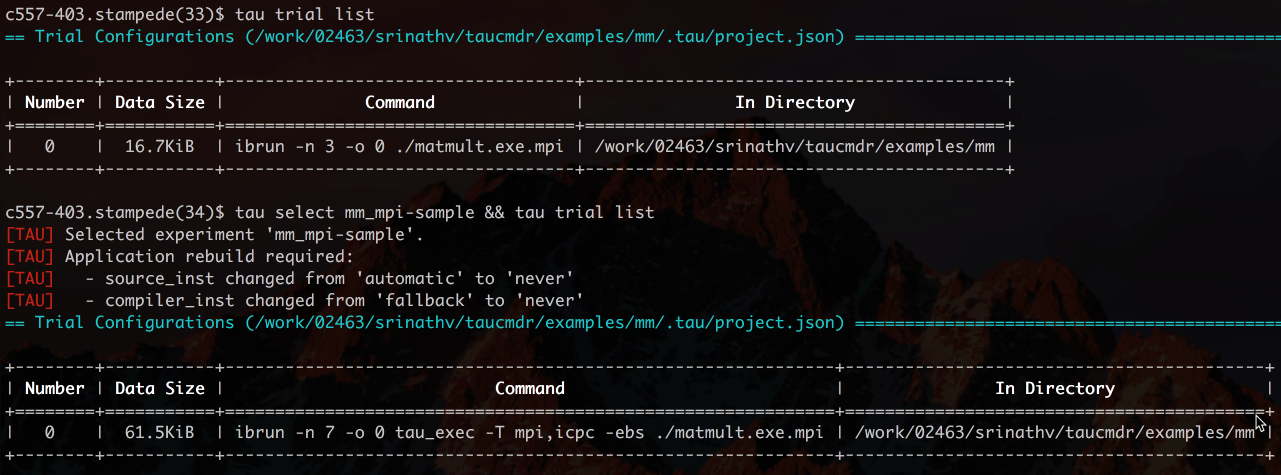
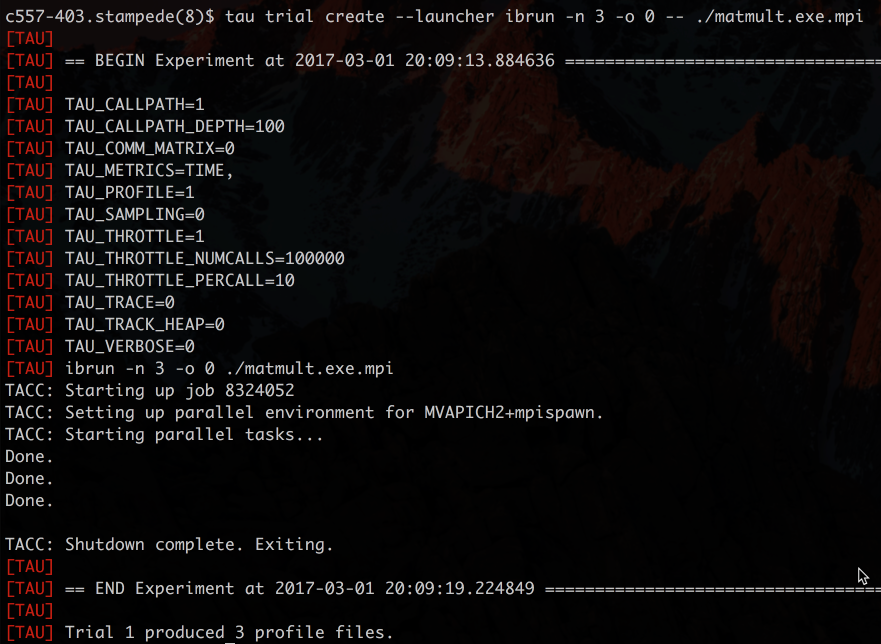
We use the “–launcher” command because Stampede and TACC systems use “ibrun” to launch MPI applications. We run our trial on 7 MPI ranks with an offset of zero cores.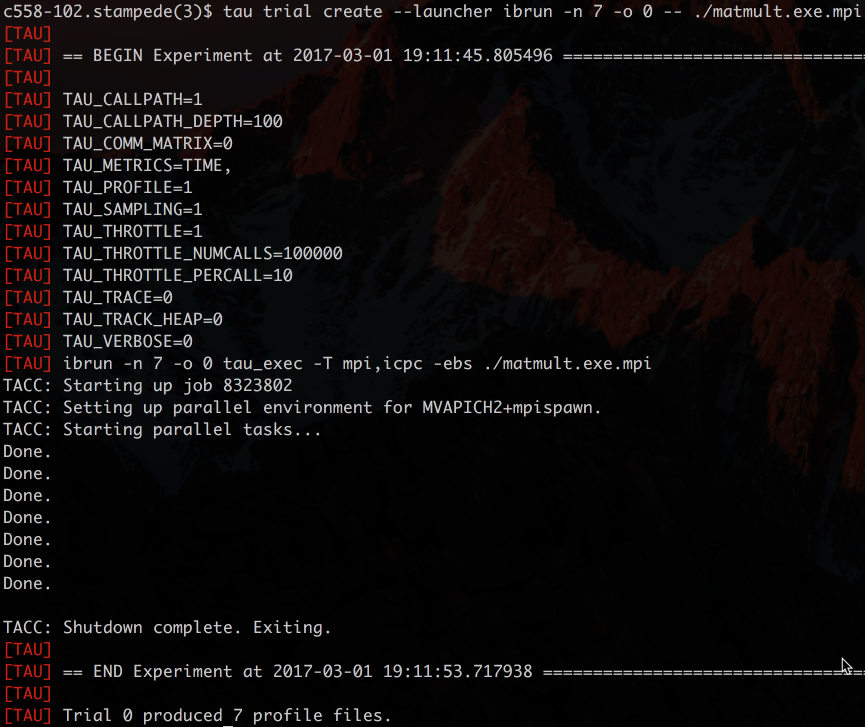
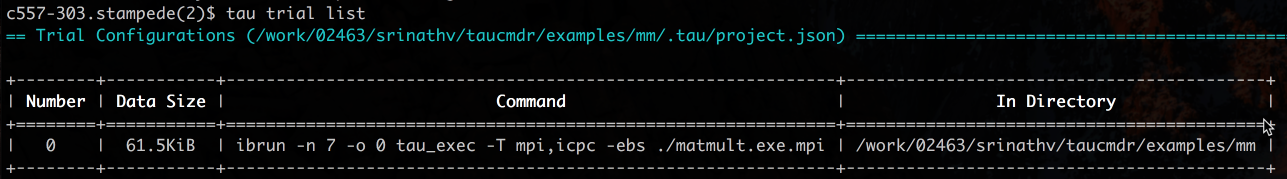
At this point, the profiles produced by TAU are stored in a particular “.tau” directory mostly hidden from the user to avoid confusion. To see what trials have been created during this experiment we use “tau trial list”.
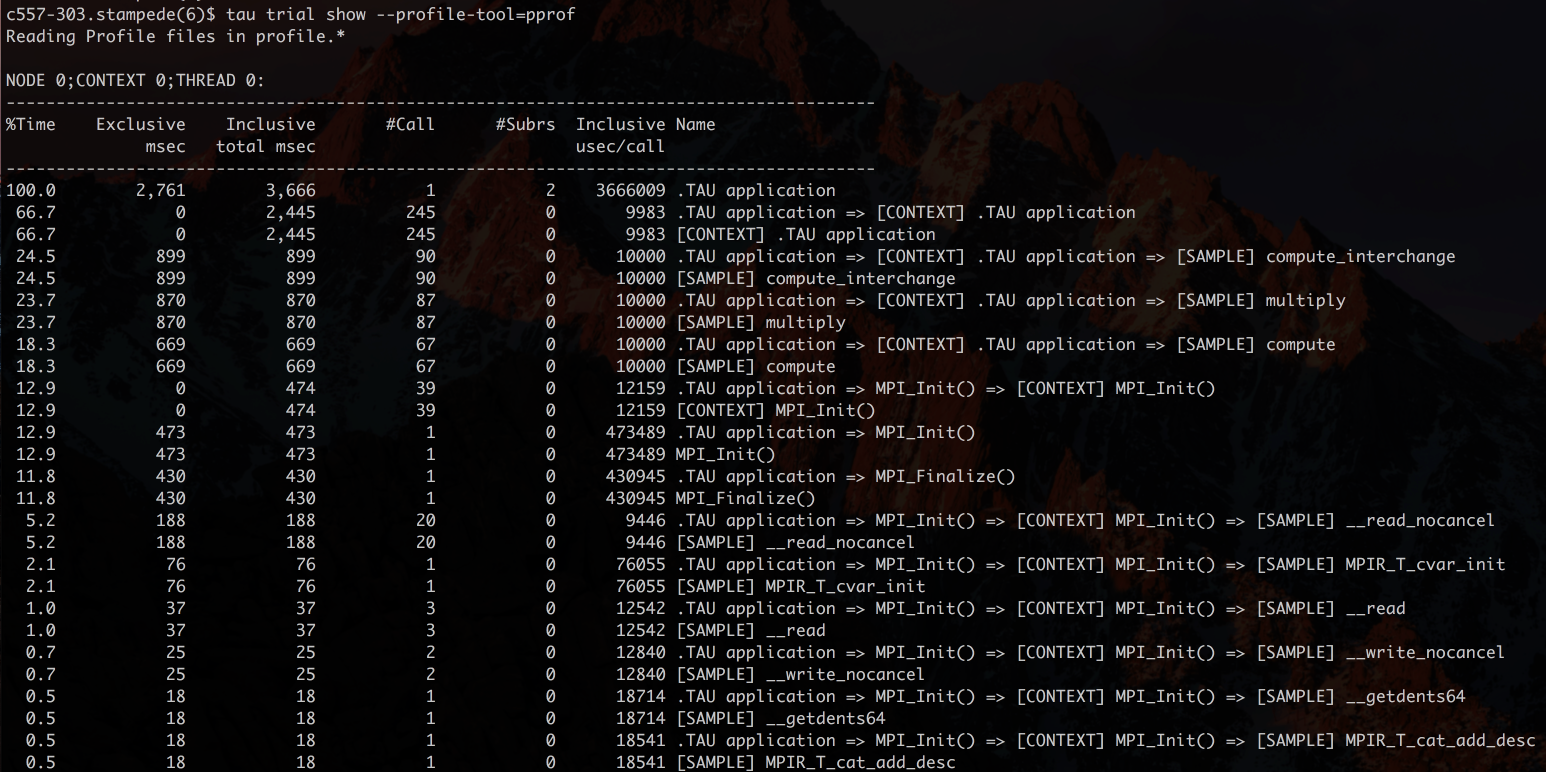
This number zero trial uses “C” like enumeration. We can view the results both graphically or via a text display. All results are viewed via “tau trial show …. “. We use the “–profile-tool” argument to use TAU’s “pprof” to give a text representation of profile information.
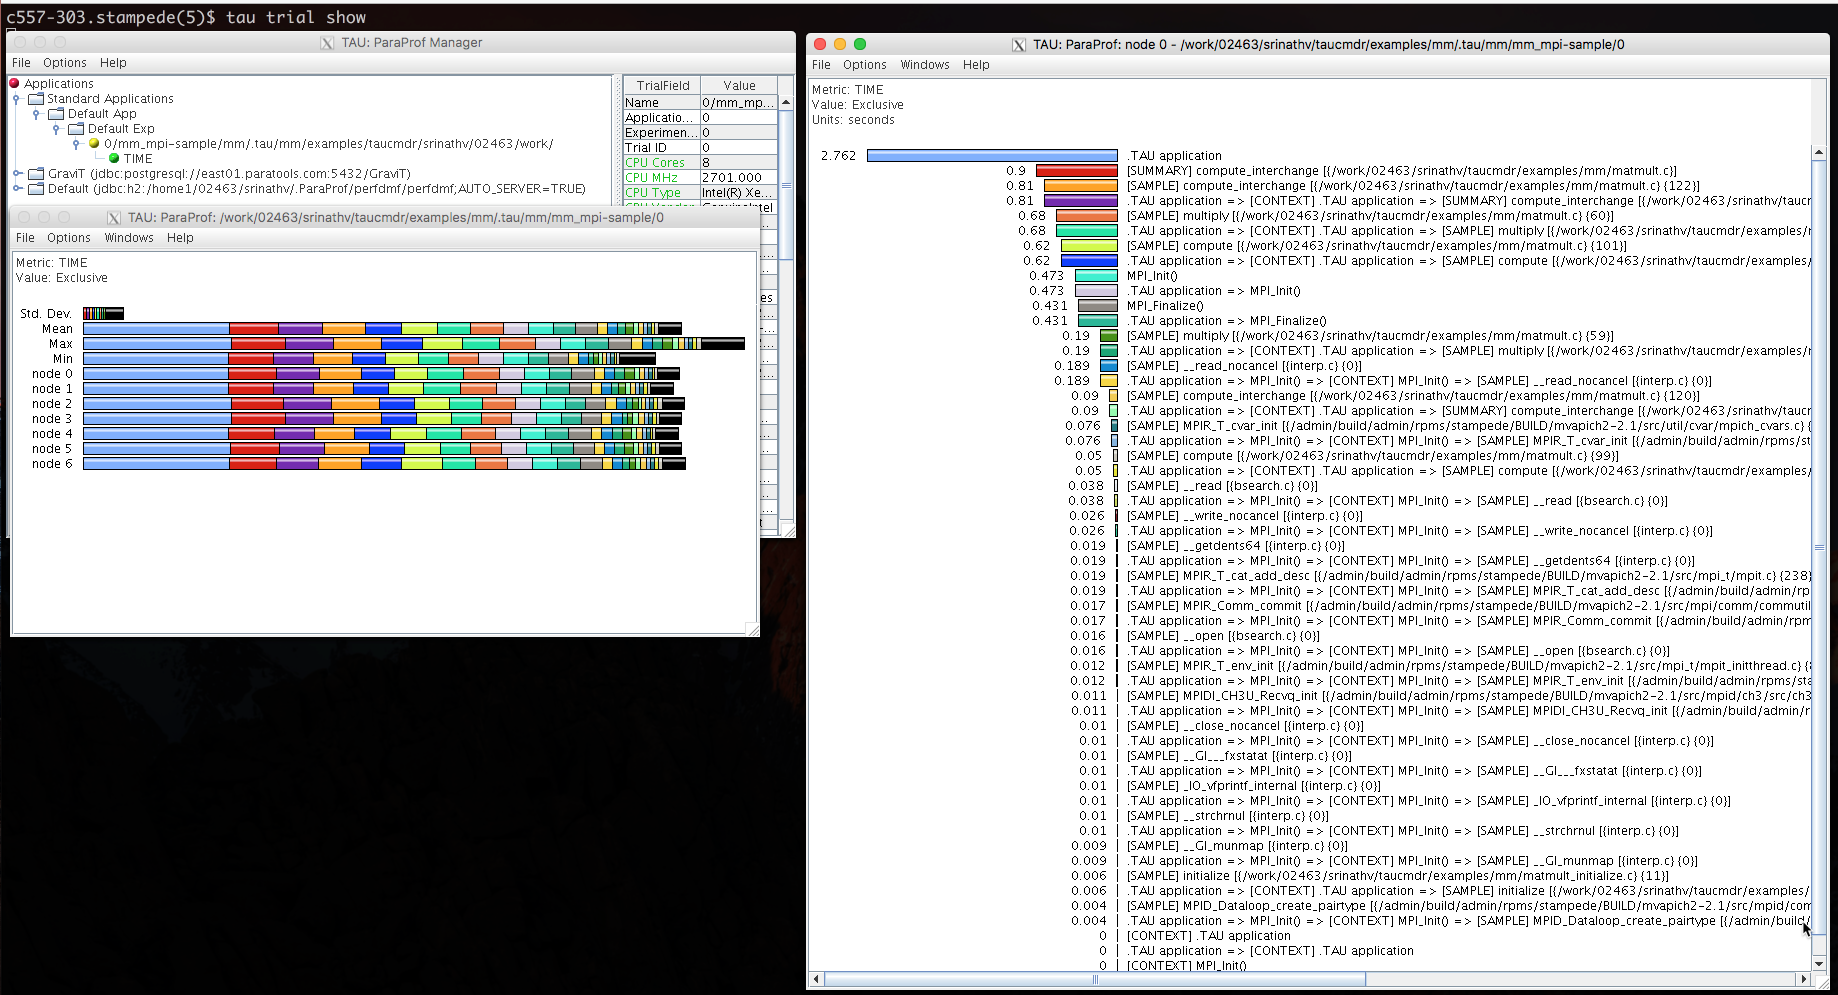
Below we use “tau trial show” which defaults to using TAU’s paraprof. This requires an X windows connection or Virtual Desktop connection. The Paraprof results shows 7 ranks with color-coding for different sampled sections. Note that sampling using binutils and libunwind can give line number ranges associated with sampled measured sections.
To change experiments, we invoke: “$tau exp select mm_mpi-inst”. This selects the experiment which use PDT to instrument source code to provide hooks for measurements. Below we how to build for our example. Note that the command looks the same as the previous experiment, but the result his different because of the experiment selected.

We now see multiple TAUs built to satisfy the already “selected” experiments.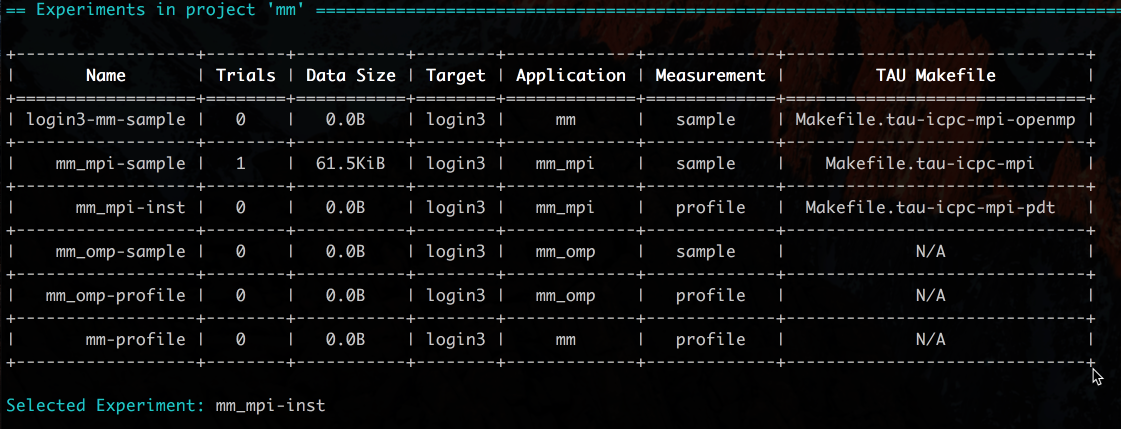
We now can invoke the run command via trial create. Note the executable name is the same, but this executable has been recompiled to have instrumentation.
We again use “tau trial show” to see results where we have 3 MPI ranks. The profiles now shows measurements by function and not line regions within a function. 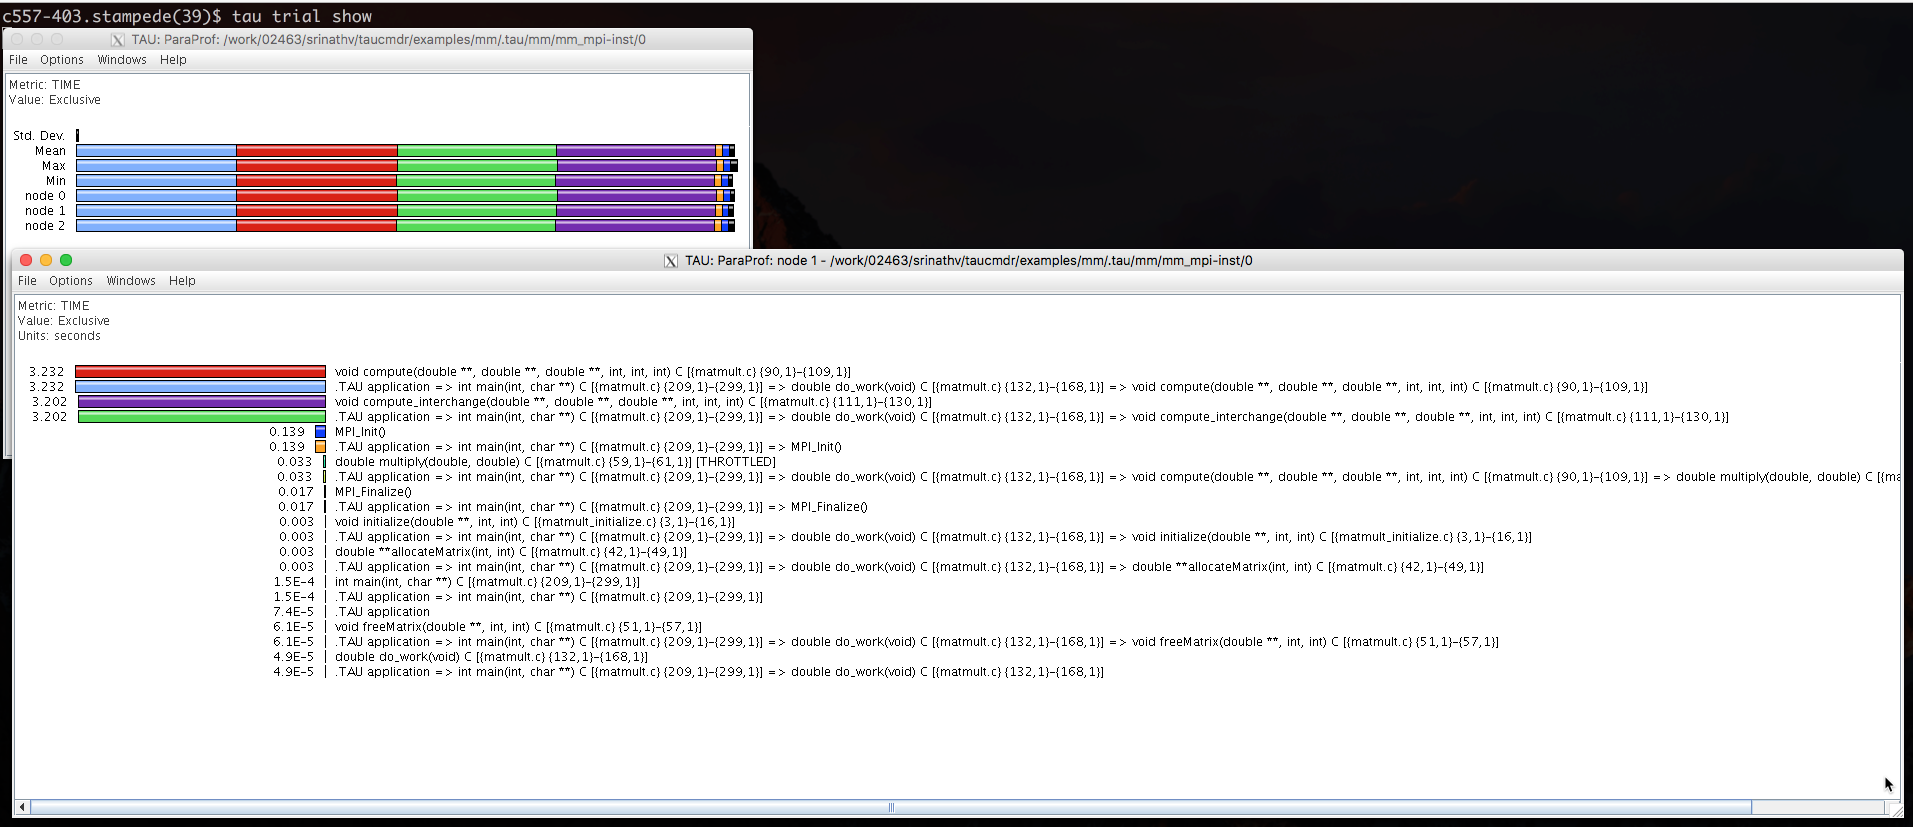
Below we show how you can access different trials associated with different experiments.
Note: “tau select <experiment name>” is the short hand.