Behind the Scenes

How does it work?

ParaTools ThreadSpotter uses dynamic binary instrumentation to efficiently capture sparse memory fingerprints representing the essence of the application’s data and thread locality properties. No restart or recompilation of the application is necessary.

The memory fingerprint carries all relevant information for ThreadSpotter to be able to extrapolate the right metrics to any cache. It can also accurately predict these metrics for cache constellations that are different from the architecture where the fingerprint was acquired.

Fortunately, the user does not need to understand the underlying memory system in detail. ParaTools ThreadSpotter will direct the user in modifying code for effective use of the memory system and increased application performance.  Developers of any experience level can quickly identify and resolve performance issues.

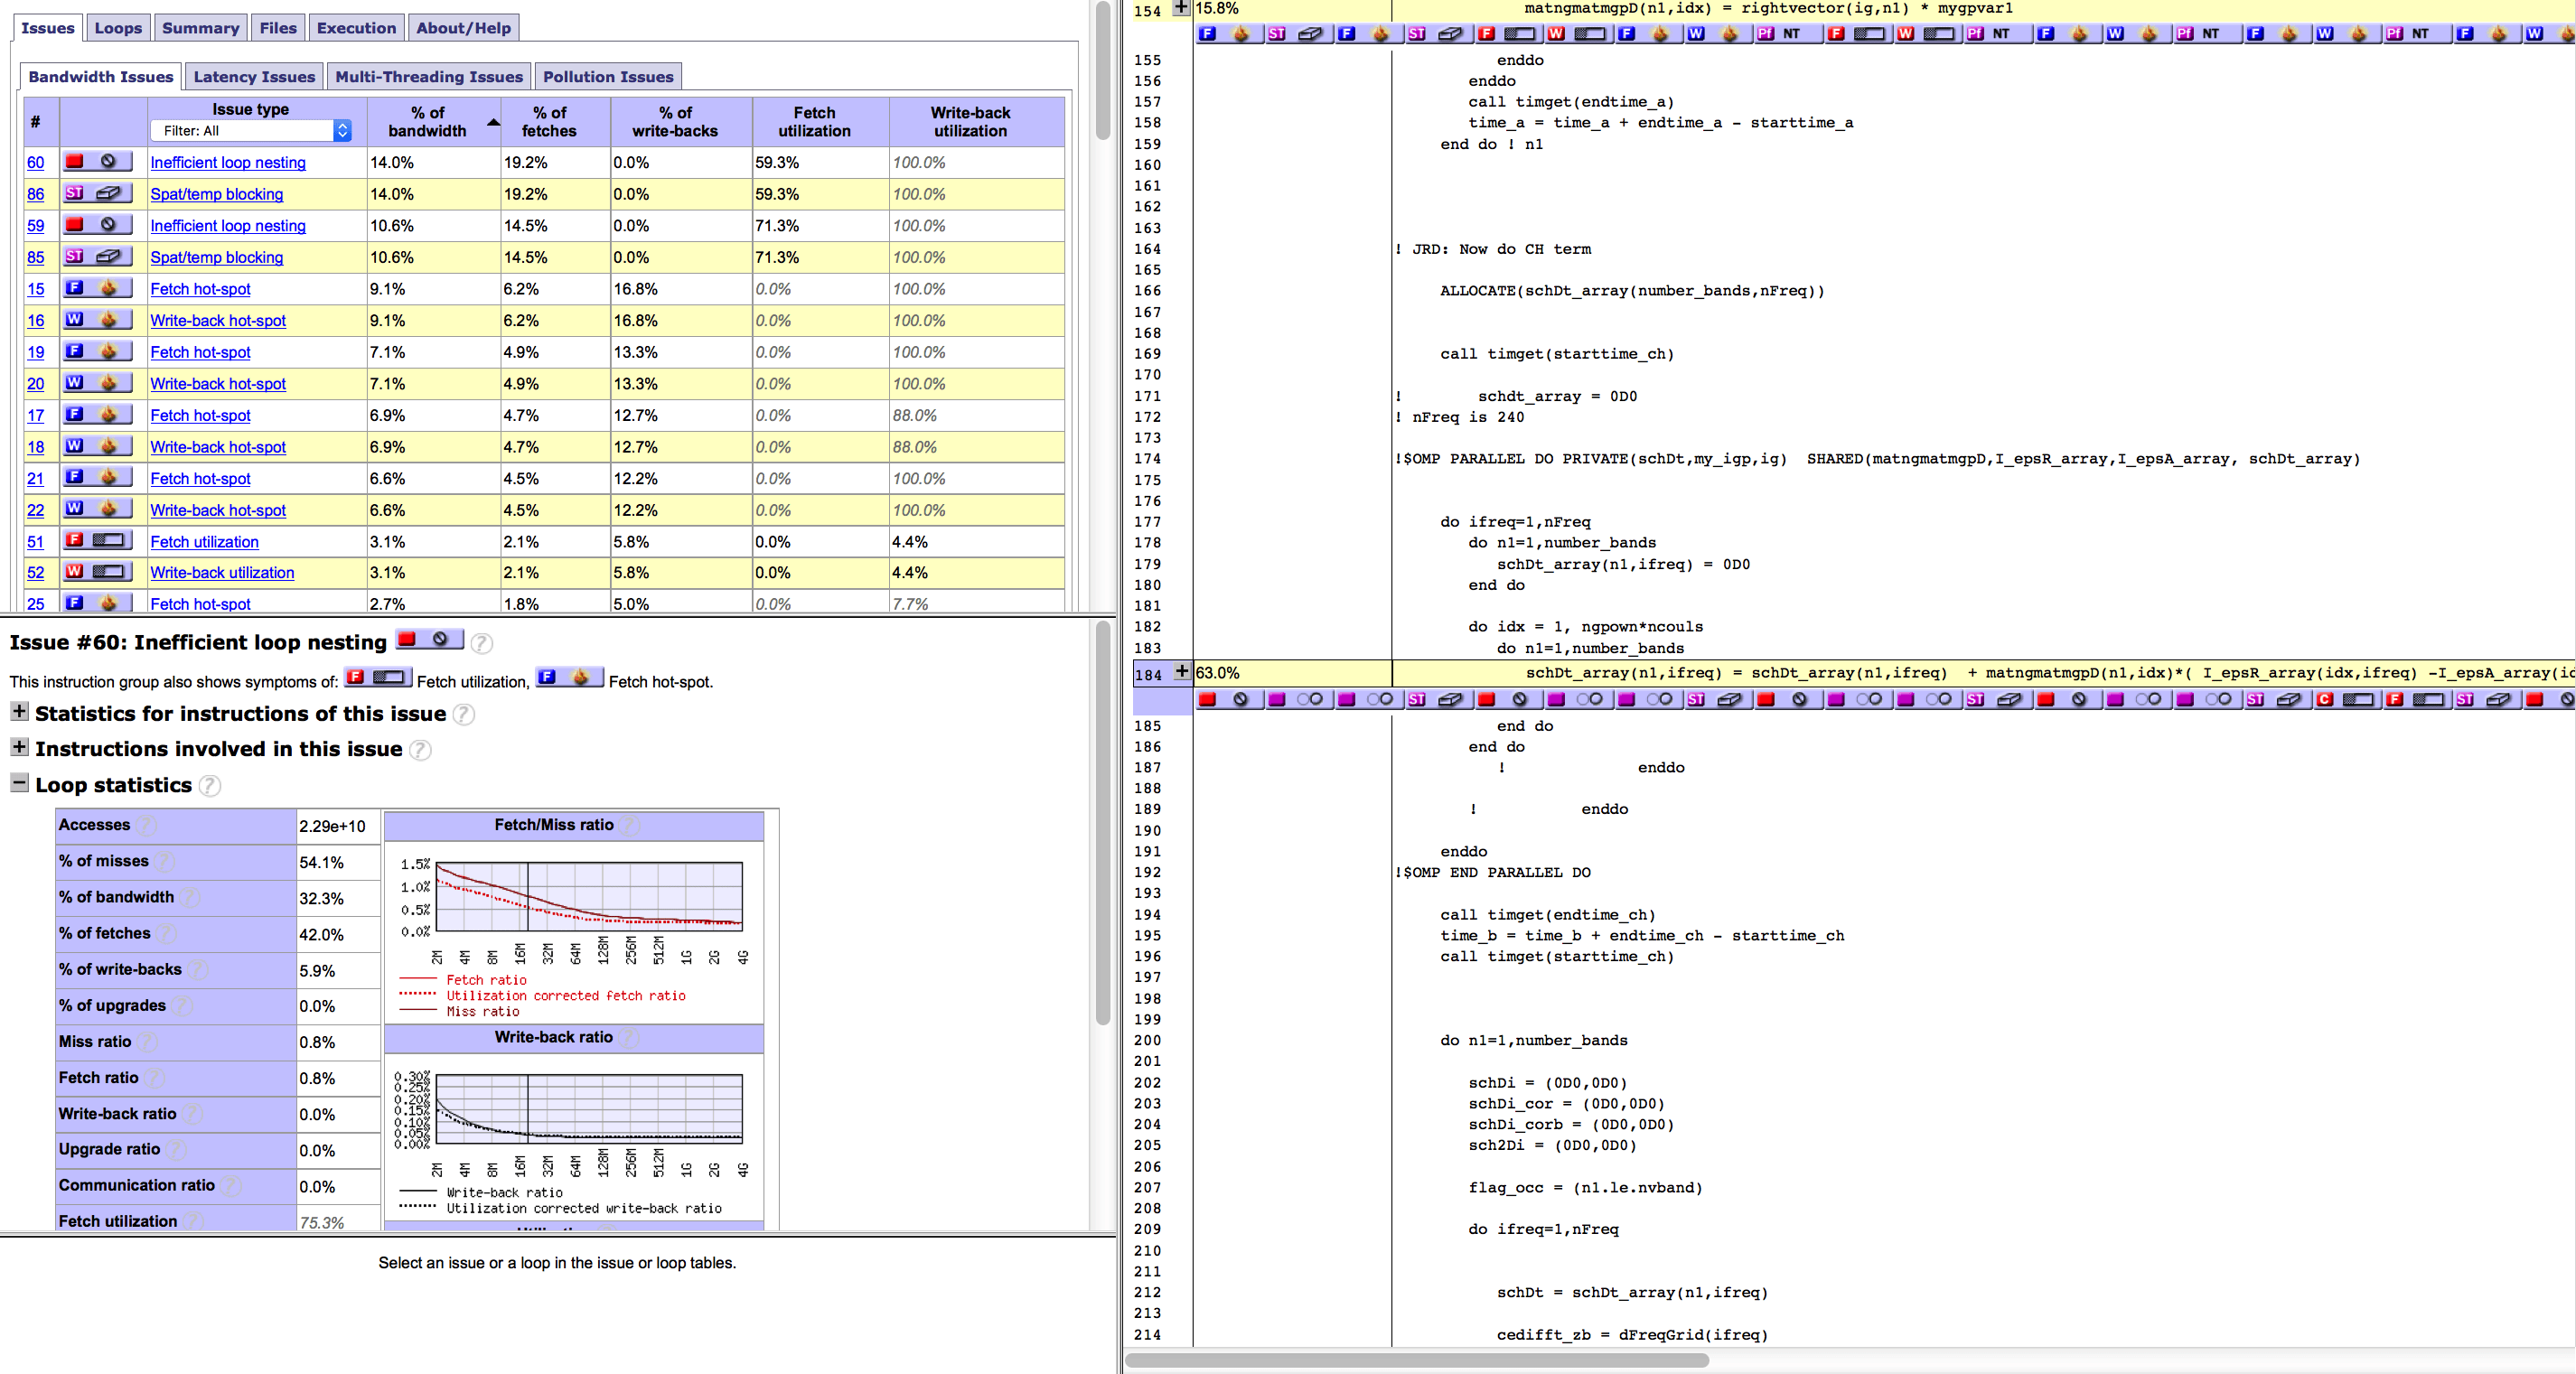
ParaTools ThreadSpotter correlates all problems to their respective source code instructions and data structures. It captures and displays call stack information leading up to the location of the problem so it’s easy to find performance issues in the application source code.  The call stack information is also displayed in the analysis and presentation of relevant advice and specific metrics for each unique instruction. In other words, ParaTools ThreadSpotter understands the hardware intricacies and their relation to performance so you can concentrate on your application.